WebPerf Snippets CLI
Run curated WebPerf Snippets headlessly via Playwright. Diagnose Core Web Vitals beyond what Lighthouse exposes and gate CI on real performance budgets.
Why
Lighthouse gives you a score. The DevTools snippets give you the diagnosis, TTFB / Resource Load Delay / Element Render Delay sub-parts, LoAF script attribution, render-blocking resources, and more. The CLI runs the same curated snippets in a headless browser so you can:
- Diagnose LCP regressions in CI without copy-pasting into DevTools.
- Gate pull requests on real performance budgets.
- Automate the snippets you already run by hand.
Install
Playwright is a peer dependency. Install both, then download the Chromium browser:
npm install --save-dev webperf-snippets playwright
npx playwright install chromium
Usage
npx webperf-snippets <url> [options]Examples
Run the default Core Web Vitals workflow (LCP + CLS, plus LCP-Subparts when LCP exceeds 2.5s):
npx webperf-snippets https://web.devJSON output (for piping into jq or CI scripts):
npx webperf-snippets https://web.dev --jsonRun a single snippet by alias or by its own name, in any case. Every snippet of the collection runs this way, with or without its category:
npx webperf-snippets https://web.dev --snippet LCP-Subparts
npx webperf-snippets https://web.dev --snippet render-blocking
npx webperf-snippets https://web.dev --snippet fonts
npx webperf-snippets https://web.dev --snippet Compression-Audit
npx webperf-snippets https://web.dev --snippet Interaction/DOM-Size-and-Depth
An unknown name exits with code 2 and lists the closest snippets.
Measure pages behind a login with a Playwright storage state (cookies and localStorage):
# Step 1: sign in once and save the session
npx playwright codegen --save-storage=auth.json https://example.com/login

# Step 2: measure an authenticated page
npx webperf-snippets https://example.com/dashboard --storage-state auth.json
The file holds live session cookies. Keep it out of version control (add it to .gitignore) and use a throwaway account when you run it in CI. The CLI exits with code 2 if the path does not exist.
Script the interactions of a page and measure them with --interact-script. The file lists the steps to run after the page loads:
{
  "interactions": [
    { "action": "scroll", "y": 600 },
    { "action": "wait", "ms": 300 },
    { "action": "click", "selector": "#menu" },
    { "action": "type", "selector": "input[name=q]", "text": "shoes" },
    { "action": "hover", "selector": ".product" },
    { "action": "wait", "ms": 500 }
  ]
}
npx webperf-snippets https://web.dev --snippet INP --interact-script interactions.json
npx webperf-snippets https://web.dev --snippet Interaction/Interactions --interact-script interactions.jsonThe snippets of the Interaction category, such as Interactions, Input-Latency-Breakdown, LongTask or Forced-Synchronous-Layout, record what happens while the page is used. With a script, the CLI installs them before the first step, runs the steps, and then reads their data, so the result holds what the steps caused. The other snippets run after the steps.
The CLI waits for the browser to report the timing of the last interaction before it reads the snippets. A script that ends right after a click still reads the page before anything the click sets in motion later has happened, such as a request or an animation, so end it with a wait step when you want to measure that.
Compare the measured values with CrUX field data (what real users experience at the 75th percentile):
CRUX_API_KEY=your-key npx webperf-snippets https://web.devField data (CrUX p75, mobile)
🟡 LCP 2.80s needs-improvement (synthetic: 2.10s)
🟢 CLS 0.0800 good (synthetic: 0.0500)
🟡 INP 220ms needs-improvement (synthetic: n/a)Get a key for the Chrome UX Report API (opens in a new tab) and pass it with --crux-key or the CRUX_API_KEY environment variable; prefer the variable, because a flag ends up in shell history and CI logs. The section appears in the human and markdown output and under crux in the --json output.
- The population follows
--viewport:desktopuses desktop data,mobileandtabletuse phone data. The heading says which one. - When the page itself has no data, the CLI looks the origin up instead and labels the section
origin-level, so it is not mistaken for page-level data. If the origin has none either, the output saysField data: not available. - A CrUX error (quota, network, no answer within 10 seconds) only skips the section. It never changes the exit code, and the key is never printed.
- INP shows
n/aas the synthetic value unless you run an interaction script.
Send the results to an endpoint after the run with --report-to:
npx webperf-snippets https://example.com --workflow audit \
  --report-to https://reports.example.com/api/report \
  --api-key $REPORT_API_KEY
Without --report-to the CLI makes no external calls. With it, the results are POSTed as JSON once the snippets have finished:
{
  "url": "https://example.com",
  "workflow": "audit",
  "timestamp": "2026-05-06T10:00:00.000Z",
  "navMs": 1240,
  "results": [],
  "meta": { "viewport": "mobile", "waitMs": 3000, "cli_version": "0.5.0" }
}
For a --snippet run, workflow is null and a snippet field carries the name. results is the same list the --json output contains, so it can include URLs and details of the measured page; send it only to an endpoint you trust.
- The URL must be
https.httpis accepted only forlocalhost, so a key is never sent in clear text. --api-keyis sent asAuthorization: Bearer <key>. Prefer thePERF_REVIEWS_API_KEYenvironment variable, because a flag ends up in shell history and CI logs. The key is never printed.- The exit code never depends on the report. A failed POST (error status, unreachable endpoint, or no answer within 5 seconds) prints a warning and the exit code stays the one the budgets and snippets decide. If the endpoint answers
{ "ok": false, "regressions": [...] }, the regressions are printed as a warning, again without changing the exit code.
Snippet aliases
| Alias | Snippet | Category |
|---|---|---|
LCP | Largest Contentful Paint | Core Web Vitals |
CLS | Cumulative Layout Shift | Core Web Vitals |
INP | Interaction to Next Paint | Core Web Vitals |
LCP-Subparts | LCP Subparts breakdown | Core Web Vitals |
fonts | Fonts Preloaded, Loaded, and Used Above The Fold | Loading |
render-blocking | Find render-blocking resources | Loading |
resource-hints | Resource Hints Validation | Loading |
preload-scripts | Validate Preload / Async / Defer Scripts | Loading |
priority-hints | Priority Hints Audit | Loading |
critical-css | Critical CSS Detection | Loading |
ttfb | TTFB Sub-Parts | Loading |
script-parties | First and Third-Party Script Info | Loading |
script-loading | Script Loading | Loading |
lazy-atf | Above-the-fold lazy-loaded images | Loading |
lazy-conflict | Images with lazy + fetchpriority conflict | Loading |
eager-below-fold | Non-lazy images outside viewport | Loading |
Gate CI on performance budgets:
npx webperf-snippets https://web.dev --budget-lcp 2500 --budget-cls 0.1Run the structural audit workflow:
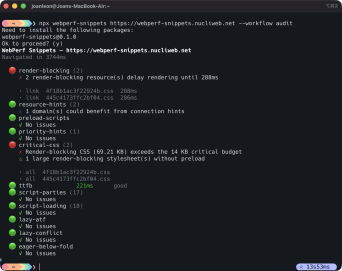
npx webperf-snippets https://web.dev --workflow auditThe audit runs these checks on one page load. Only an issue of severity error makes the command exit with code 1; warnings and notes appear in the report without changing the exit code.
| Step | Checks |
|---|---|
render-blocking | Render-blocking CSS and scripts |
resource-hints | Preload, preconnect and dns-prefetch hints that nothing uses, and origins that need one |
preload-scripts | Scripts that combine preload with async or defer |
priority-hints | fetchpriority on the images that matter |
critical-css | Critical CSS inlined in the head |
ttfb | Time to first byte split into its sub-parts |
script-parties | First-party and third-party scripts |
script-loading | Loading strategy of every script |
compression | Text resources sent without compression |
inline-scripts | Size and parser blocking of inline scripts |
inline-css | Size and weight of inline CSS |
webfonts | Web fonts that fail, never load or weigh too much |
content-visibility | Offscreen sections that could use content-visibility |
prefetch | Prefetch hints for files the page already uses, and their total size |
lazy-atf | Lazy-loaded images above the fold |
lazy-conflict | Images with both loading="lazy" and fetchpriority="high" |
eager-below-fold | Images below the fold that load eagerly |
video | Poster, preload, autoplay and dimensions of <video> elements |
dom-size | DOM node count and depth |
oversized-images | Images whose file has many more pixels than the page shows |
image-audit | The LCP image, dimensions, loading and format of every <img> |
svg-bitmaps | SVG files that embed bitmaps |
The steps that make requests of their own run last, so those requests do not change what the earlier steps read.
Run the loading workflow, which measures timing on a real page load:
npx webperf-snippets https://web.dev --workflow loadingIt runs these steps on one page load. As in the audit, only an issue of severity error makes the command exit with code 1.
| Step | Measures |
|---|---|
TTFB | Time to first byte, with a rating |
FCP | First Contentful Paint, with a rating |
render-blocking | Render-blocking CSS and scripts |
resource-hints | Preload, preconnect and dns-prefetch hints that nothing uses, and origins that need one |
scripts | Loading strategy and size of every script |
script-timings | DNS, connection, request and response time of first-party and third-party scripts |
ttfb-resources | Time to first byte of every resource, slowest first |
js-execution | Script execution time by script |
third-party-impact | Requests, size and main-thread time per third-party domain |
fonts | Preloaded fonts, and whether the page uses them above the fold |
cache-strategy | Cache headers of the resources, anti-patterns and uncompressed text |
The step that makes requests of its own (cache-strategy reads cache headers with HEAD requests) runs last, so those requests do not change what the earlier steps read.
Run the interaction workflow, which measures what happens while the page is used:
npx webperf-snippets https://web.dev --workflow interaction
npx webperf-snippets https://web.dev --workflow interaction --interact-script interactions.json
It installs the Interaction snippets, runs the interactions, and then reads them. Without --interact-script it scrolls the page, because clicks and typing belong to each site; with the script it runs the steps of the file instead. As in the other workflows, only an issue of severity error makes the command exit with code 1.
| Step | Measures |
|---|---|
long-tasks | Main-thread tasks over 50 ms, with their blocking time |
long-frames | Long animation frames and the scripts behind them |
scroll | Scroll frame rate, non-passive listeners and CSS that affects scrolling |
layout-shifts | Layout shifts, split between loading and interaction |
forced-layout | Forced synchronous layouts |
interactions | Every interaction with its latency and rating |
input-latency | Input delay, processing time and presentation delay of each event type |
interactions and input-latency need a click or a type step. When the interactions have none, they appear as skipped with the reason, and they do not count as errors. When the script has a click but the page records no interaction, they report an error, which tells you the step did not reach an element that responds.
Simulate a mobile viewport (default) or switch to desktop:
npx webperf-snippets https://web.dev --viewport mobile
npx webperf-snippets https://web.dev --viewport desktop
Show all items, including passing checks:
npx webperf-snippets https://web.dev --verboseOptions
| Option | Description |
|---|---|
--workflow <name> | Workflow to run. Default: core-web-vitals. Options: core-web-vitals, loading, audit, interaction. |
--snippet <name> | Run a single snippet by name, alias or Category/Name path. |
--json | Output JSON instead of formatted text. |
--viewport <preset> | Viewport preset. Default: mobile. Options: mobile, tablet, desktop. |
--wait <ms> | Post-load wait before evaluating snippets. Default: 3000. |
--interact-script <path> | JSON file with the interactions to run after the page loads: scroll, click, hover, type and wait. |
--storage-state <path> | Playwright storage state (cookies and localStorage) for pages that require authentication. |
--crux-key <key> | Add CrUX field data (p75) next to the measured values. Prefer CRUX_API_KEY. |
--report-to <url> | POST the results to this https URL after the run. No external calls without it. |
--api-key <key> | Sent as a Bearer token with --report-to. Prefer PERF_REVIEWS_API_KEY. |
--budget-lcp <ms> | Exit 1 if LCP exceeds this value. |
--budget-cls <score> | Exit 1 if CLS exceeds this value. |
--verbose | Show all items, including passing checks. |
--headed | Show the browser window (debug). |
-h, --help | Show help. |
Follow-up steps
The results of a run can add steps. They run on the same page load, appear after the steps of the workflow, and show the reason that added them. Each snippet runs once, and a snippet the workflow already ran is not repeated. The results of a follow-up do not add steps of their own.
| When | Adds |
|---|---|
| LCP over 2.5 s | LCP-Subparts |
| LCP over 4 s | LCP-Trail |
| The LCP element is an image | LCP-Image-Entropy and Image-Element-Audit |
| The LCP element is a video poster | LCP-Video-Candidate and Video-Element-Audit |
| CLS over 0.1 | Layout-Shift-Loading-and-Interaction |
| CLS over 0.25 | The lazy images above the fold, the fonts, the critical CSS and the images without dimensions |
| TTFB over 600 ms | TTFB-Sub-Parts |
| FCP over 1.8 s | Find-render-blocking-resources |
A follow-up informs: the error issues it reports appear in the report and do not change the exit code. Use the audit workflow, or --snippet with the snippet itself, to gate on them.
Exit codes
| Code | Meaning |
|---|---|
0 | All checks passed. |
1 | Budget violation, a snippet errored, or a step of the workflow reported an error issue. |
2 | Usage error (missing URL, unknown workflow). |
Run it from an AI agent
Each snippet page has a Copy prompt button above the code. The prompt asks an AI agent with a terminal to run that snippet with this CLI, pinned to the published version, and to report the result. It includes the install command, the --snippet name, an --interact-script when the snippet needs interactions, and how to read the status, issues and corsLimitedAnalysis fields. The agent asks for the URL if you do not give it one.
The snippets an agent cannot run in a meaningful way have no button: the Fetch & XHR Timeline overrides, which need DevTools Local Overrides, the Long Animation Frames helpers, and Network Bandwidth & Connection Quality, because headless Chromium reports the connection of the machine it runs on. The Back/forward cache prompt says that the result is partial, since the CLI does not navigate back.
CI integration
GitHub Actions example, fail the PR if LCP exceeds 2.5s:
- run: |
    npm install --no-save webperf-snippets playwright
    npx playwright install --with-deps chromium
    npx webperf-snippets https://staging.web.dev --budget-lcp 2500 --budget-cls 0.1
GitHub Action
The repository ships a composite action that installs the CLI and Chromium, runs a workflow and exposes the result as markdown, so any repository can gate on performance budgets without extra setup:
jobs:
  webperf:
    runs-on: ubuntu-latest
    permissions:
      pull-requests: write
    steps:
      - uses: nucliweb/webperf-snippets/.github/actions/webperf-snippets@main
        id: webperf
        with:
          url: https://staging.example.com
          budget-lcp: 2500
          fail-on-budget: "false"

      - uses: actions/github-script@v7
        env:
          BODY: ${{ steps.webperf.outputs.markdown }}
        with:
          script: |
            await github.rest.issues.createComment({
              ...context.repo,
              issue_number: context.issue.number,
              body: process.env.BODY,
            });

      - if: steps.webperf.outputs.exit-code != '0'
run: exit 1| Input | Default | Description |
|---|---|---|
url | required | URL to measure. |
workflow | core-web-vitals | Workflow to run: core-web-vitals, loading, audit or interaction. |
budget-lcp | 2500 | LCP budget in ms. An empty value disables the check. |
budget-cls | 0.1 | CLS budget. An empty value disables the check. |
fail-on-budget | true | Fail the step when a budget is exceeded or a snippet errors. Use "false" to read exit-code and decide yourself. |
cli-version | latest | Version of the webperf-snippets npm package to run. |
| Output | Description |
|---|---|
markdown | The results as markdown. Also written to the job summary. |
exit-code | Exit code of the CLI: 0 passed, 1 budget exceeded or a snippet errored, 2 usage error. |
The markdown includes text taken from the measured page, so pass it to other steps through an environment variable (env: and process.env) as above, never by interpolating ${{ steps.webperf.outputs.markdown }} inside a script. With fail-on-budget: "false" the action step always succeeds, which lets later steps post the comment before the job fails. Without permissions: pull-requests: write the comment step cannot post on a pull request.
LCP, CLS and INP vary by 15 to 30% on shared runners; prefer the deterministic audit workflow for a gate, or generous budgets.
How it works
- Launches headless Chromium via Playwright.
- Pre-registers
PerformanceObservers for LCP and layout-shift before navigation. - Navigates and waits for the page to settle.
- Evaluates each snippet’s IIFE in the page context, capturing the returned object.
- Applies the workflow’s decision tree to enqueue follow-up snippets.
- Renders results (human-readable or JSON) and exits with the appropriate code.
Known limitations
- Synthetic INP ≠ field INP:
--interact-scriptmeasures the latency of the steps it scripts. Real INP reflects the worst interaction across real sessions; use RUM for field data. - CLS in headless is conservative: layout shifts that only happen on scroll are missed unless you script the scroll.
- First navigation only: each invocation runs one URL. SPAs need the post-route URL passed directly.
- Follow-ups see the page as it is: they run after the steps of the workflow on the same page load, so they read what is there when they run, not a fresh load.
Further reading
- GitHub Repository (opens in a new tab), source code and issue tracker
- npm package (opens in a new tab), changelog and releases